Developed by Henry Gantt and the Polish engineer Karol Adamiecki, a Gantt chart is a practical tool for planning projects. Thanks to an overview of the planned tasks, everyone involved in a project knows which activity is to be carried out and its deadline. This solves many organisational problems.
It is one of the methods that has been developed so that companies can maximise their chances of achieving their objectives.
How to make a schedule with gantt?
The interest in using GANTT in your management
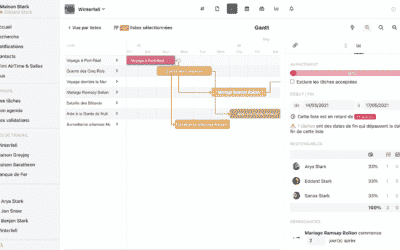
The interest of a Gantt planning is that it is possible to visualize at a glance :
- The start and end date of a project as well as all the phases and tasks that make up the project.
- The tasks in the project, and the start and end date of each task.
- Which collaborators are linked to each task.
- An estimate of the time taken to complete the tasks.
- How the tasks overlap or are related.
The task planning method
To create a Gantt chart, whatever your specifications, you need to follow this process:
- Define the tasks in your project.
- Determine the dependencies* (e.g. start to start) between the tasks, if any.
- Develop project deadlines and determine project milestones**.
- Assign roles to each member involved in the project.
*Milestones are stopping points in the process that allow everyone involved to review the progress of the project. They allow the stages to be validated.
**There are 4 different dependencies:
- End to end: the 2 tasks must be completed simultaneously
- End to start: a task can only start once the previous one has been completed. This is the standard chaining mode.
- Start to Finish: a task cannot be completed until the previous one has started.
- Start to start: a task can only be started if the previous one has also started.
For example, a website design project cannot really move forward until the website mock-up has been delivered. So, making the mock-up is the most urgent and important task, and within this task are several sub-tasks (Benchmark, Design, Illustration). Starting certain tasks sometimes depends on the completion of a previous task, so it is necessary to signal its importance to speed up the passage to the next elements.
Develop a project schedule
Timing and deadlines are very important issues in the life of a project. The initial estimate of the expected time of the tasks is very important.
How many days, how many hours do you have for this project?
Keep in mind that any project can be delayed for any number of reasons. A very important rule in project management is to keep track of past projects in order to analyse and improve your project management. You should systematically keep time to evaluate the flexibility needed to create your schedule.
Assigning tasks to your team members
Again, the rule of thumb is that keeping a record of each individual performance is a good idea for optimising your project management. For example, if a specific team member often finishes tasks late, you should avoid assigning them priority tasks.
In addition, you need to keep in mind the potential other projects of your employees, as well as their days off or holidays, which can be a hindrance to completing a project on time.
Why make a gantt chart?
What is on a gantt chart?
The start and end dates give the project manager visibility of the deadlines. This way they can know when their project starts and ends.
Projects are usually made up of a number of sub-tasks. You will be able to follow their progress, so that no task is forgotten.
The calendar, which shows the end date of the tasks, will notify you to remind you of the deadlines in order to finish the whole project on time.
The dependency of tasks is also highlighted with a Gantt schedule. You know which tasks can be done when you want, and which ones are dependent on a preceding task.
A Gantt shows the exact status of your project by indicating which tasks have already been completed. By selecting the date of your choice, you can see the tasks to be completed and you will know if you are on track to complete the project on time.
The benefits of Gantt in project management
Using a Gantt chart brings several valuable benefits to businesses and managers. But what are they?
Visibility and clarity
A Gantt chart brings together all the tasks, deadlines and progress of your teams in one overview.
It also provides clarity on how tasks are organised and resources allocated.
Communication
Replacing meetings, a Gantt chart keeps everyone involved in a project with the information they need to keep the project on track.
Motivation
This kind of tool gives your teams a better idea of their overall performance and will allow them to adapt their way of working according to the given deadline.
By better understanding the interdependencies of tasks, they will be able to better understand the impact of a delay on the project.
Time management
A Gantt chart helps to define realistic deadlines and to optimally define when a task should be completed.
It also ensures that other projects requiring similar resources are not compromised.
Flexibility
The role of a project manager requires agility and flexibility as he/she often has to deal with the difficulty of unforeseen events and last minute changes.
With a project manager, you can modify tasks and resources accordingly.
What to choose? Pert or gantt?
Defining the formats
Both PERT and Gantt charts are tools to help managers track the progress of projects and tasks. The PERT format shows tasks in a network diagram, where the interdependence of tasks is emphasised. Whereas the Gantt chart simply shows the tasks and their timelines as a horizontal bar.
PERT (Program Evaluation and Review Technique) diagrams are planning tools used primarily to determine the duration of tasks before a project is started. Companies use this tool in a number of ways, but usually in this way:
- Defining the activities and tasks that will lead to the success of a project.
- Estimating the time needed to complete each task and developing a preliminary schedule.
- Determining the interdependence of each task in relation to others.
- Define project milestones and critical path***.
- Start and finish dates of tasks are written in boxes.
Gantt charts are often used to track the status of tasks and communicate project constraints. This format can be used to break down tasks into sub-tasks. Companies use this tool in a number of ways, but usually in this way:
- Linear presentation of tasks on a bar chart where the duration is explicit.
- Highlighting the start and end dates of tasks and the overall project.
- Coordination of resources and scheduling of team members.
- Horizontally, the timeline is shown according to the chosen time unit, and vertically, the list of tasks is shown in the left-hand column.
*** The critical path is the method of identifying the tasks required to complete a project. In effect, the critical path is the longest series of tasks to be completed in order to finish a project.
Which format to choose?
Choosing a PERT chart is wise for:
- Predicting the time it will take to complete a project and each task within it
- Plan, manage and organise large projects
- Define and communicate the interdependence of tasks
Choosing a Gantt chart makes sense to:
- Predict how long it will take to complete each task
- Communicate the roles and responsibilities of each actor in your tasks
- Visualise and share the progress of the project with your teams
What is the difference between PERT and Gantt?
A manager can use both PERT and Gantt planning to maximise the chances of completing a project on time. However, there are fundamental differences between Gantt and PERT:
Visualisation
A Gantt schedule is built on the basis of spreadsheet calculations and bar charts. You therefore need applications designed for this purpose to create one.
As for the PERT chart, the form is free. A PERT chart can therefore be created on all graphic design applications.
Project planning
Very useful to help manage a project once it has started. A Gantt chart cannot, however, assist you in the planning stage.
However, a PERT schedule is specifically designed for planning a project, identifying milestones, identifying interdependencies and calculating the time required to complete a project.
Creation and interpretation
The Gantt chart is more intuitive and easier to understand than the PERT chart. However, it is relatively complicated to construct compared to a PERT chart.
How do I create a Gantt chart in Excel?
Via Microsoft excel, it is possible to create a free Gantt chart, but it will not be intelligent or intuitive. However, there is a good solution if you have a small budget to carry out your project.
Create a chart and present it in a graphical form
Step 1: Define all the tasks in your project with their start dates, their names and which collaborators will do them and estimate the time needed to do each task
Step 2: Calculate in a new column the end date of each task based on the start date and the estimated time the task will take.
Step 3: Add a diagram
Select task name, start date, task duration in your worksheet:
Then go to Insert > Chart > Stacked Bar Chart.
Select Start Day in the chart. Then “No colour” for the colour in the drop-down menu. In order to view the task only from start to finish and not from the beginning of the project to the end.
The limitations of a free tool like Excel
Be aware that this diagram has some limitations.
You will not be able to assign tasks to your employees intuitively and easily.
You will not be able to make changes quickly or easily
You will not be able to get a clear overview as you would in a dedicated software. You will not be able to see the dependencies between tasks either. If you have start-to-start or end-to-start dependencies, you won’t be able to see the difference.
For large projects, it would be wise to use a different method and acquire project management software with integrated Gantt charts. A solution such as Wimi, for example, can be used in Gantt format via its range of functions and this will make your work much easier.