What is a Pert chart?
In order to plan a project effectively, it is necessary to take advantage of efficient tools and proven methods. Among these solutions, we can cite the PERT diagram (Program Evaluation and Review Technique). Such a diagram is very useful for estimating the duration of projects or even identifying dependencies between tasks. To enable you to implement such a tool, we are going to explore the origin of the PERT chart as well as its advantages and disadvantages.
The basics of the Pert chart
To find the origin of the PERT chart, we have to go back to the 1950s. At that time, the U.S. Navy needed a method to manage very complex projects. The aim was to rapidly develop nuclear ballistic missiles under the Polaris Project in order to catch up with the USSR. In 1958 the PERT method was then created, which made it possible to reduce the project deadline by 4 years.
Pert chart definition
Finally, what is a PERT chart? It is simply a visual method that allows you to organize and manage the various tasks of a project. The tasks are then represented in the order in which they were completed and the dependencies between the tasks are easily identifiable.
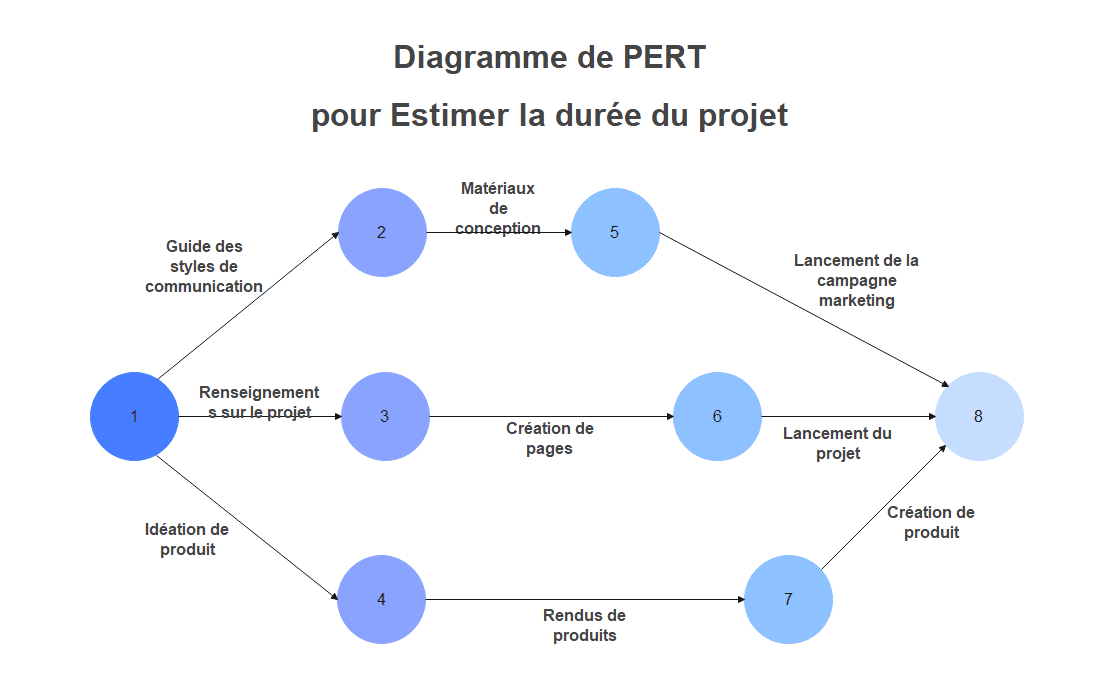
The key components
Any PERT chart includes at least three essential elements:
- Knots: Nodes are tasks represented in the form of circles or rectangles. Within each node, various information is listed such as the name of the task, its duration and the resources required to complete it.
- Arrows: These arrows are used to illustrate dependencies between tasks. For example, an arrow going from task A to task B is used to mean that task A must be completed before task B can be started.
- Paths: Any line on the diagram that consists of a set of tasks linked together by arrows is a path. So the longest path in the diagram is the critical path.
A PERT chart is easily understandable thanks to the visual representation of the elements that compose it. In a few moments, the observer is in fact able to identify the tasks, understand their dependencies and estimate the critical path.
Project Management and Pert Chart
After understanding how the PERT chart works, it's important to know when to implement it.
When and why should you use it?
Allowing you to manage a very large number of tasks, the PERT chart is a very relevant tool in the context of large-scale projects. This is especially the case if the project has many interdependent tasks, some of which are critical, whose progress must be monitored.
If you use it for large projects, you will be able to identify the critical path quickly by calculating the probable duration of each task. For this reason, this method is very relevant when there is a high degree of uncertainty about the duration of the various tasks.
The role of the PERT chart in project management
If the PERT diagram is so often used in project management, it is because it makes it possible to meet major challenges, especially in terms of meeting deadlines.
The graphical representation of such a tool is ideal for quickly and easily visualizing the structure of the project. All tasks and relationships between them are thus observable in a few moments. Critical tasks, for example, are identified without delay. However, these tasks are very important, as they can have an impact on the delivery date when they are not completed on time.
In addition, when designing the project and evaluating the resources required to achieve the objectives, the PERT diagram is relevant. Indeed, it allows you to more easily estimate the total duration of the project thanks to the identification of the critical path.
Finally, it is also possible to use it when allocating the various resources of the project. Critical tasks and deadlines are then taken advantage of to assign tasks and sub-tasks to different collaborators in order to ensure that these tasks are completed on time.
What are the pros and cons of this diagram?
To provide an honest view of this method, it is essential to list the strengths, but also the weak points of the PERT chart.
Advantages:
- Visual representation: All project members have the opportunity to quickly understand the overall organization of the project, the order of the tasks to be carried out and their interdependencies.
- Critical path identification: In order to best manage the time resource, identifying the critical path is essential. Thanks to it, the project manager can focus resources in the right place at the right time.
- Risk Management: The PERT chart is also relevant for reducing risks, as it identifies tasks that have or do not have room for maneuver. It is therefore possible to make adjustments if necessary.
Disadvantages:
- Complexity of the method: Although it is designed to handle ambitious projects, the presence of a large number of interdependent tasks can make the diagram very complex to manage.
- Time estimate: The duration of the tasks here is based on estimates. If the estimates are lacking rigor, the critical path as well as the total duration of the project can vary greatly and have serious consequences.
- Parallel tasks: While the PERT chart is very useful for visualizing tasks and their interdependencies, it is not as relevant as the Gantt chart for managing numerous tasks to be completed in parallel.
An essential project management tool
Despite some disadvantages such as its complexity, the PERT chart remains a method to know and master to achieve your goals. Ideal for large projects, it allows you to access a clear visual representation including tasks, their interdependencies, but also the critical path. Thanks to it, it becomes easier to focus on essential tasks, meet deadlines and allocate resources well. To take full advantage of this, we recommend using appropriate software tools to create a PERT chart quickly to save time and increase productivity.