Manage your projects with concrete data
Visualize the progress of your tasks in real time: status, workload, daily performance, burndown by sprint. Filter by lists and time periods to refine your analysis. Export your reports for your team meetings and customer reports.
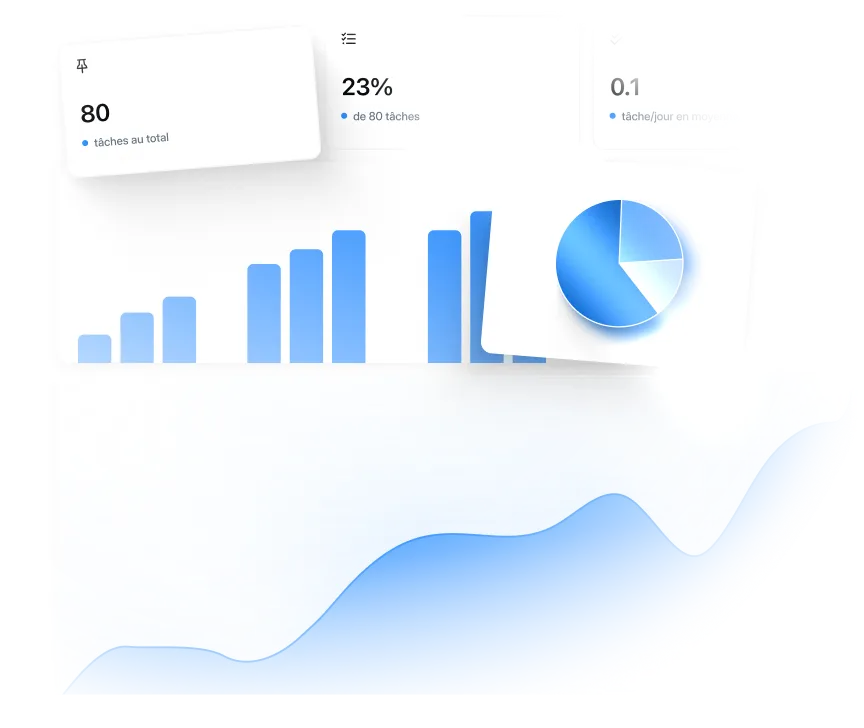


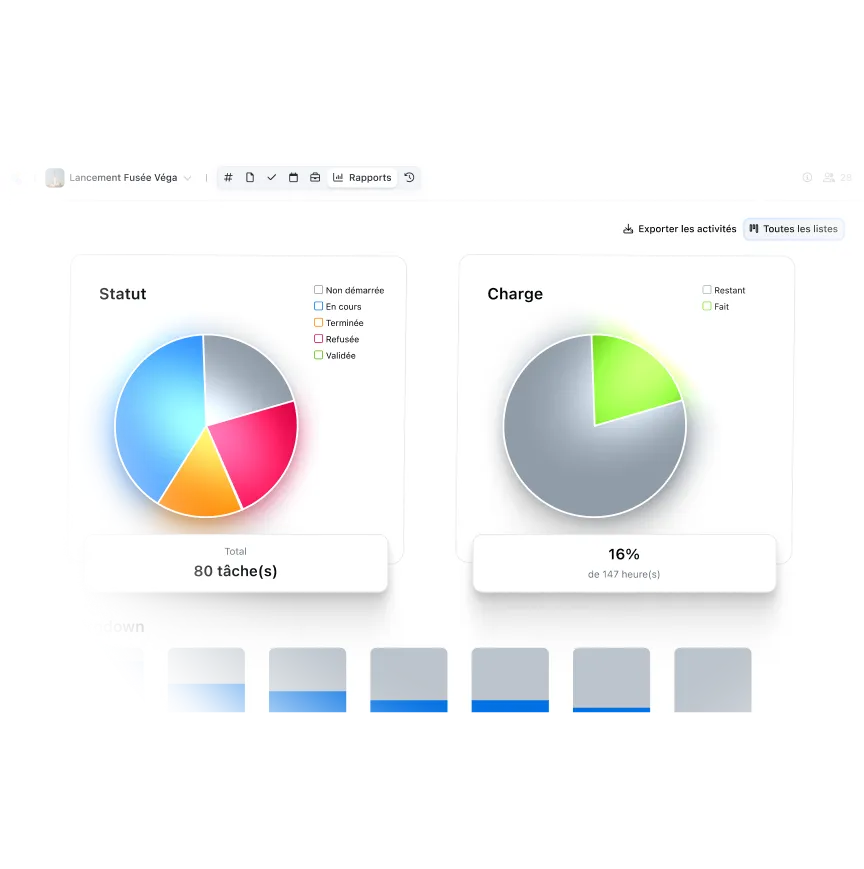
Analyze your tasks from all angles at a glance
Global status (completed, in progress, not started), workload completed, daily burndown for agile sprints, average performance per day, tag usage by theme. Each graph answers a specific question: where is the project at, who is performing, what to prioritize. Switch between views in one click according to your current needs.
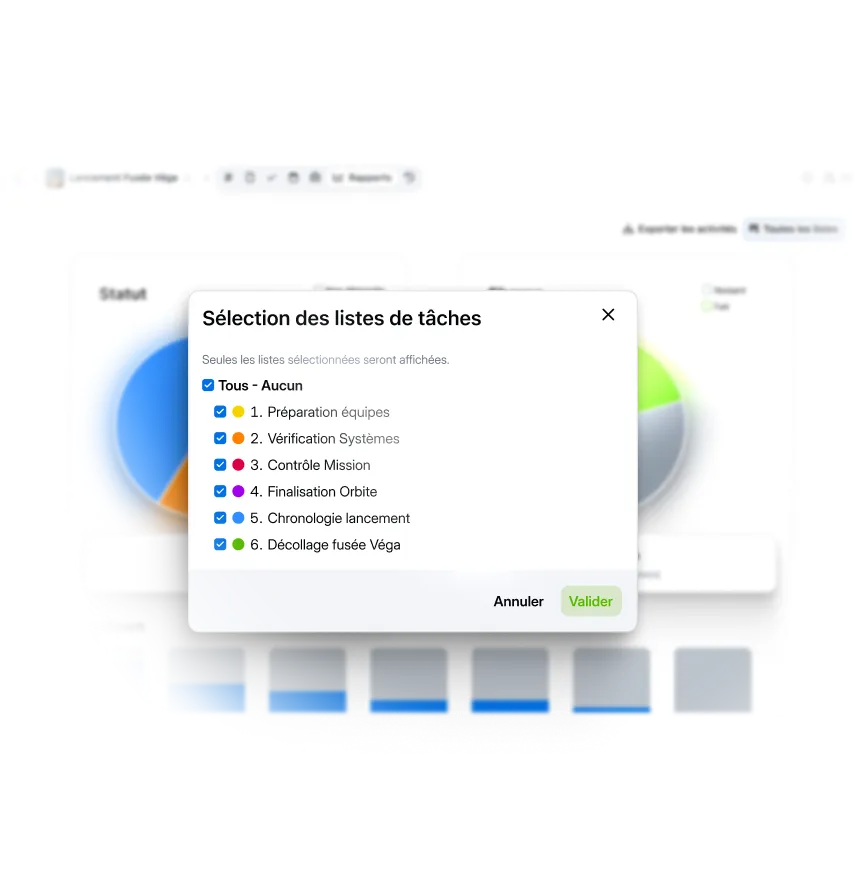
Select which lists to show in your reports
Check the lists relevant to your analysis: “Team Preparation”, “System Verification”, “Mission Control”. All charts are updated instantly. Compare multiple lists simultaneously or focus on a single team. Perfect for reports targeted by department or specific sprint analysis.
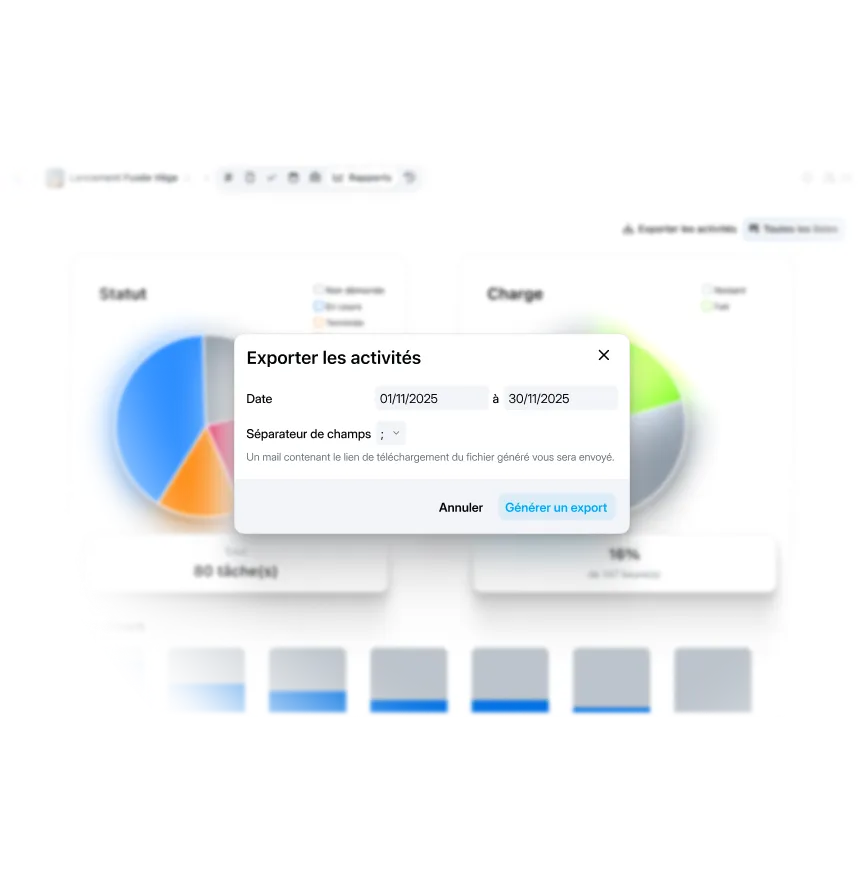
Generate your activity reports in one click
Export graphics and statistics for your team meetings, management committees or customer reports. Format that can be used immediately without reprocessing. Demonstrate progress with facts rather than feelings. Complete history kept to follow the evolution of the project over time.
“Wimi is a solution perfectly suited to collaboration in project mode. Its ease of handling and the flexibility offered according to uses convinced us. Covid-19 and the periods of teleworking have only amplified the need for such a solution to maintain exchanges and continue our projects.”Lorem ipsum dolor sit amet, consectetur adipiscing elit, sed do eiusmod tempor incididunt ut labore and dolore magna aliqua. Ut enim ad minimim veniam, qui nostrud exercising ullamco laboris nisi ut aliquip ex ea commodo consequat. Duvet high grain color wine In voluptate velit esse illum dolore eu fugiat nulla pariatur.

“Wimi is a solution perfectly suited to collaboration in project mode. Its ease of handling and the flexibility offered according to uses convinced us. Covid-19 and the periods of teleworking have only amplified the need for such a solution to maintain exchanges and continue our projects.”
"Wimi nous permet de centraliser notre processus de création et de planification de contenus. La plateforme nous apporte une vision claire et centralisée de notre production. Je le recommande sans hésiter aux équipes qui veulent gagner en agilité et optimiser leur processus de création de contenus."

"Wimi nous permet de faciliter la communication entre le staff et les joueurs, de fluidifier le partage des données et d’accélérer la planification de nos évènements sportifs. Le budget est aussi très attractif au regard du périmètre fonctionnel, riche et ergonome couvert par la solution."

"Wimi est un outil sécurisé et sécurisant qui répond clairement aux besoins d’une profession réglementée par le secret professionnel. Travailler sur nos dossiers depuis la plateforme est devenu une évidence pour nous. Nous sommes bluffés par la facilité avec laquelle nos clients et partenaires adoptent la solution."

A complete suite to manage your business
Each space has its own isolated statistics. Analyze “Campaign com Q1” and “Budget forecast Q2” separately without mixing data. Reports accessible only to members of the space concerned.
All charts reflect the real status of your Kanban tasks: statuses, assignments, dates, tags. Update a task, the reporting is recalculated instantly. No double entry or manual synchronization. Your tasks are the only source of truth.
The reports show the overall progress. The activity feed details who did what. Macro vision with Reporting + advanced details with Activities. Perfect complementarity for daily management and for your performance audits.
Become an expert in collaborative work


Your questions about reports
Do reports update automatically?
Yes, instantly. As soon as a task changes status (from “In progress” to “Completed”), is assigned to someone, or a tag is added, all charts are automatically recalculated. No manual action required.Real-time refresh:
- You mark 3 completed tasks → the Status graph is updated immediately
- Your team is moving forward on multiple lists → Burndown reflects live progress
- An employee tags tasks → the Tags graph is enriched instantly
The data displayed is always up to date, with no need to generate or recalculate anything. You are driving on real numbers, not obsolete exports from last week.
Can I compare multiple projects or workspaces?
No, reports are isolated by workspace. Each space has its own independent statistics based solely on its tasks. Why this separation?
- Confidentiality: Sensitive project data is only visible to authorized members
- Relevance: Comparing “Rocket Launch” and “Marketing Campaign” does not make business sense
- Performance: Fast graphics because the scope is limited to one project
For multi-project analysis: Open each space individually and export the reports. Then consolidate into your own external presentation or dashboard. This approach respects access rights while allowing global vision for management.
Alternative: If you manage several similar projects (example: 5 product developments), create dedicated lists in a single space rather than 5 separate spaces. You can then filter and compare via the selection of lists.
Are all my tasks included in the reports?
Yes, all tasks in the space are included in the statistics regardless of their original Kanban list. You then filter by lists to refine the analysis. What is measured:
- Statuses: Not started, In progress, Completed, Rejected, Validated
- Charge: Estimated hours vs hours worked (if provided)
- Tags: All tags used in space
- Dates: Creation, modification, completion of tasks
What is NOT measured:
- Detailed time spent per person (no individual timetracking)
- Comments or discussions about tasks
- Attachments or linked documents
Tip: For relevant reports, structure your Kanban lists well from the start (“Sprint 1", “Backend Team”, “High Priority”) rather than mixing everything up. You can filter intelligently afterwards.
Can I customize the appearance of the charts?
No, charts have a standardized format and are not customizable. The colors, visualization types and layouts are fixed to ensure consistency and readability. What is fixed:
- Chart type (pie for Status/Charge, bars for Burndown/Tags, curve for Performance)
- Color palette (standard Wimi color codes)
- Layout and layout
What you control:
- Which lists to show via filters
- What period to analyze (week, month, custom)
- Which graph to consult according to your needs
For custom presentations: Export data and recreate your own charts in PowerPoint, Excel or your BI tools if you have specific graphics guidelines. The Wimi export provides usable raw data.
In what format are the reports exported?
Exports are done via the “Export activities” button and generate a usable file containing the displayed data. Export content:
- Full list of tasks affected by your filters
- Details: title, status, assigned to, dates, tags, original list
- Change history if enabled
Typical use: The export is not an image of the graphs but the source data that feeds them. Perfect for:
- Reprocess in Excel for custom analyses
- Archive the status of the project as of a given date
- Provide granular details that the charts summarize
To share visual graphics: Take screenshots of Wimi reports and integrate them into your presentations. The visuals remain clear and professional for meetings without manipulation.
Who can see workspace reports?
All members of the space can consult the reports, regardless of their role (administrator, member, guest). The statistics reflect collective activity and are therefore visible to the entire team. No restriction by default: If someone has access to the workspace, they see the tasks AND the associated reports. Impossible to hide the statistics from certain members while giving them access to tasks. For ultra-sensitive projects: If you need to hide performance data from certain collaborators, two solutions:
- Separate spaces: Create a dedicated management space with a consolidated vision
- Manual exports: Consult reports, export data, and share only relevant extracts
Good to know: The reports don't show any sensitive personal data (no individual time spent monitoring). They measure collective progress, not personal performance. Healthy transparency for team coordination.

Visualize the progress of your projects in real time
Five analytical views to manage effectively: status, load, burndown, performance, tags. Filter by lists and export reports for team meetings.